Eight Questions To Help You With Price Action Bar Analysis
By Galen Woods ‐ 8 min read
Price action analysis is critical for designing a sound trading setup. These questions will guide you to arrive at your analysis systematically.
Price action analysis might be intuitive and straightforward to seasoned traders. But a systematic approach to getting started seems elusive for beginners. In this tutorial, you’ll find eight questions to guide you by analyzing raw price action bars (candlesticks).
Here, I use bars and candlesticks interchangeably. Although these two popular chart types look different, they contain the same pieces of market information, namely:
- Open
- High
- Low
- Close
In this tutorial, we focus on the short-term price action bar (candlestick) analysis.
We will mostly look at how to analyze a single bar using the preceding bar as a basis. Towards the end, we will include more context into our analysis.
While the analysis might hint at potential trading setups, we are not discussing entries and exits explicitly.
By answering these eight questions, you will be assembling your market observations. Then, by integrating these observations, you will arrive at your market analysis. And that will form the basis for any trades you consider.
Let’s begin.
Questions To Guide Your Price Analysis
Question #1: How long are the top and bottom shadows (wicks, tails)?
The upper and lower wicks (or shadows) of candlesticks reflect the buying and selling pressure, respectively.
Let’s look at an intraday example to understand how observing wicks can be useful for a trader.
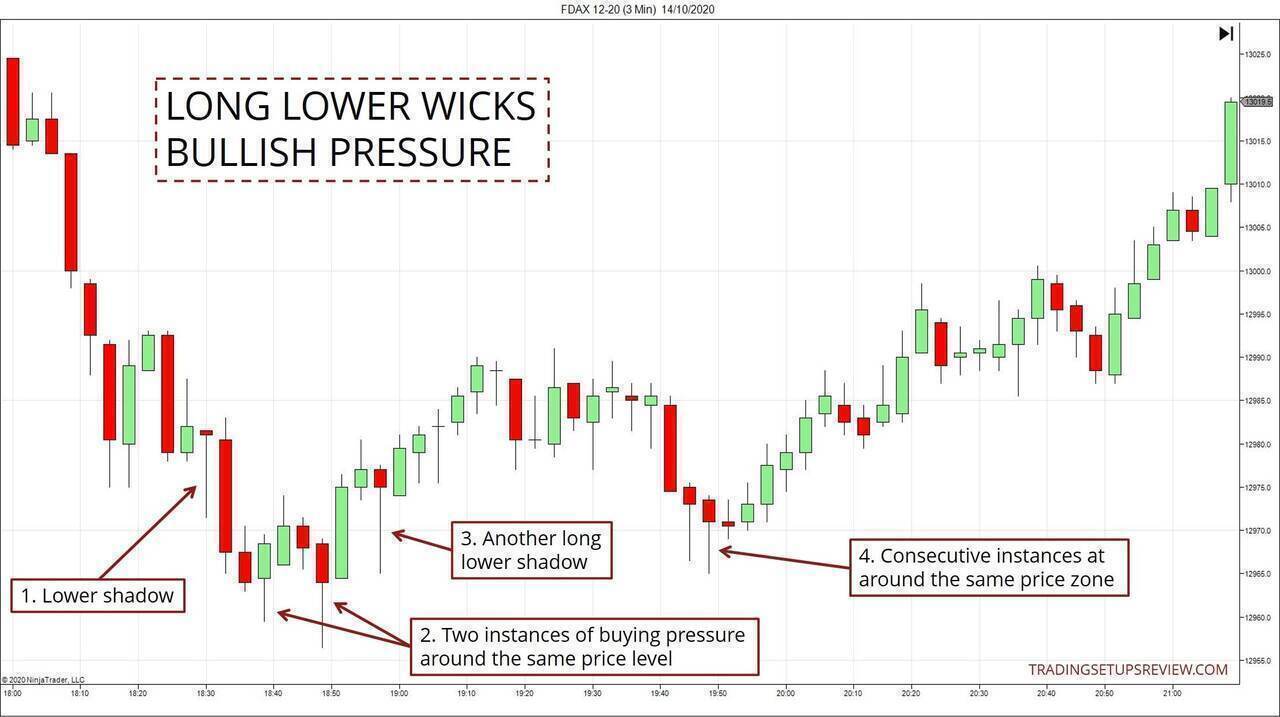
- This was the first instance of a long lower wick, a sign of buying pressure. But the market blew it off, and at that point, there was no reason to think that the bullish pressure would persist.
- These are two instances of bullish pressure (long lower wicks) around the trend extreme.
- Another sign of buying pressure here.
- Two consecutive bars showing buying pressure; bullish trend kicked off from here.
(Also, observe that there were hardly any prominent upper wicks in the chart above.)
The Pin Bar pattern is a classic example that makes use of the power of lengthy shadows.
Question #2: Is it a Trend Bar?
A bar might trade over a wide range of prices. But the real conclusive movement of a bar is the difference between its open and its close (candle body). And this is an aspect that we should not overlook in our analysis.
The idea of a Trend Bar encapsulates this.
The picture below shows how to identify a Trend Bar.
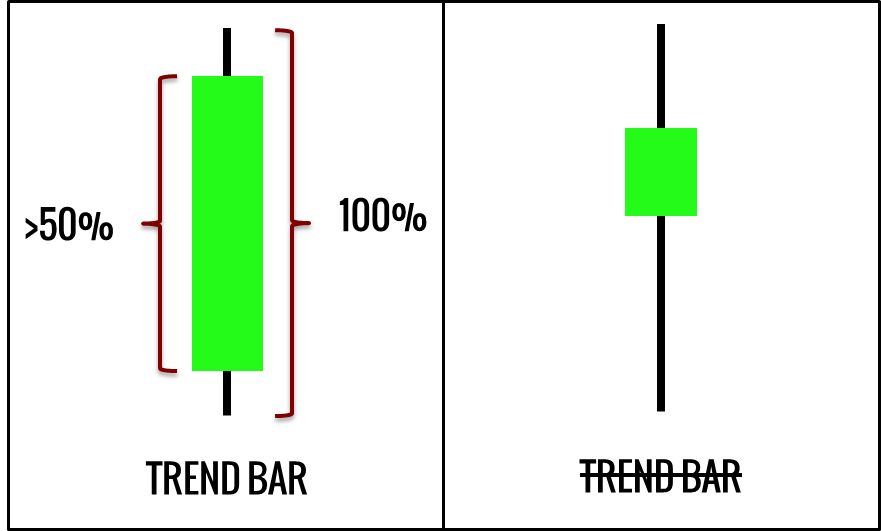
The body of a Trend Bar takes up at least 50% of the entire bar range. And loosely speaking, any bar that is not a Trend Bar, we call it a Doji.
In a nutshell, Trend Bars represent the meat of the market fluctuations. It’s easy to imagine how the concept of Trend Bars can be helpful. For instance, if there are no Trend Bars for the past ten bars, the market is likely consolidating.
Let’s take a look at an example.
In the chart below, Trend Bars have a cyan background.
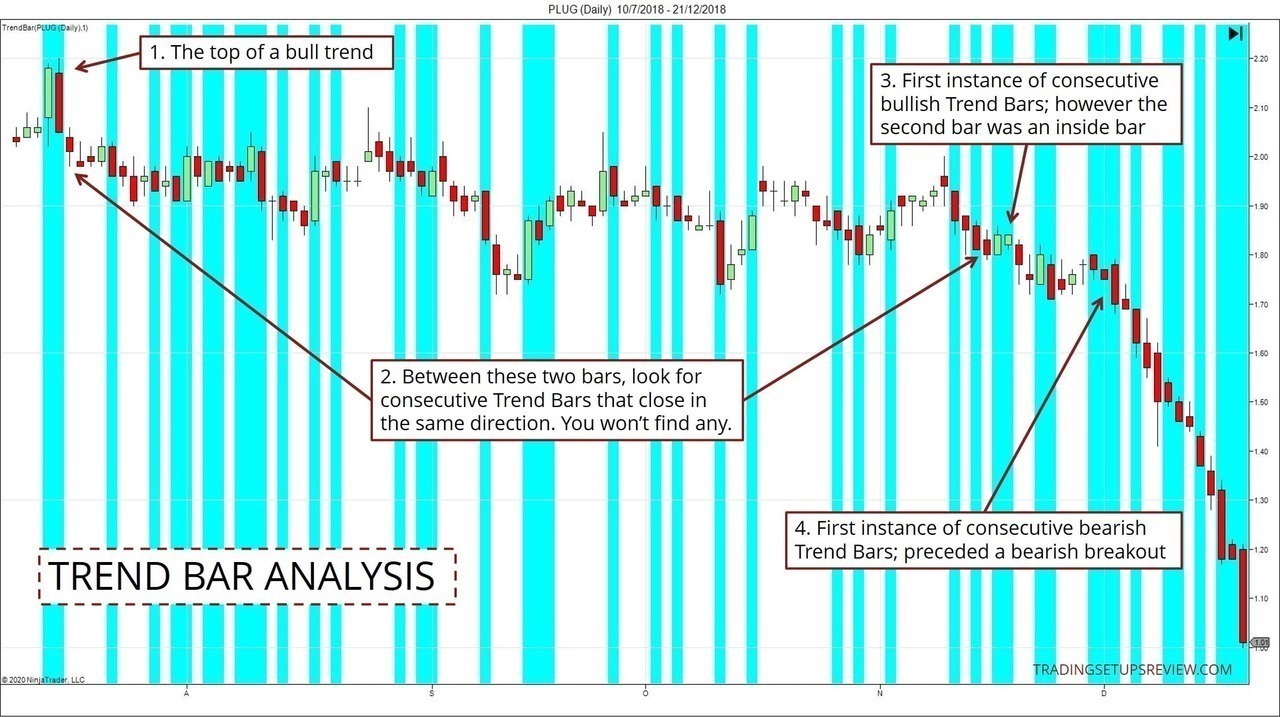
- This point was the top of a bull trend.
- Between these two points, there were no instances of consecutive Trend Bars that closed in the same direction. Most of the Trend Bars were isolated instances. The five cases of consecutive Trend Bars consisted of bars that closed in opposing directions.
- Here, we got the first instance of consecutive bullish Trend Bars. However, the second bar was an inside bar, so it was not indicative of bullish momentum.
- This instance of consecutive bearish Trend Bars was different. It showed evident bearish strength and clued us into a decisive bearish breakout.
This example shows how paying attention to a specific Trend Bar composition helps pinpoint a change in the market phase (a breakout from a range into a trend).
For more guidelines on how to analyze price action with Trend Bars, refer to this tutorial.
Question #3: Are there consecutive bars closing in the same direction?
In the market, there are trends at various levels. Consecutive bars closing in the same direction is one of the easiest ways to identify minor trends.
Consecutive bars closing in the same direction also help us to focus our price action analysis. On top of that, the number of successive bars matters too.
The example below shows how they contribute to market analysis.
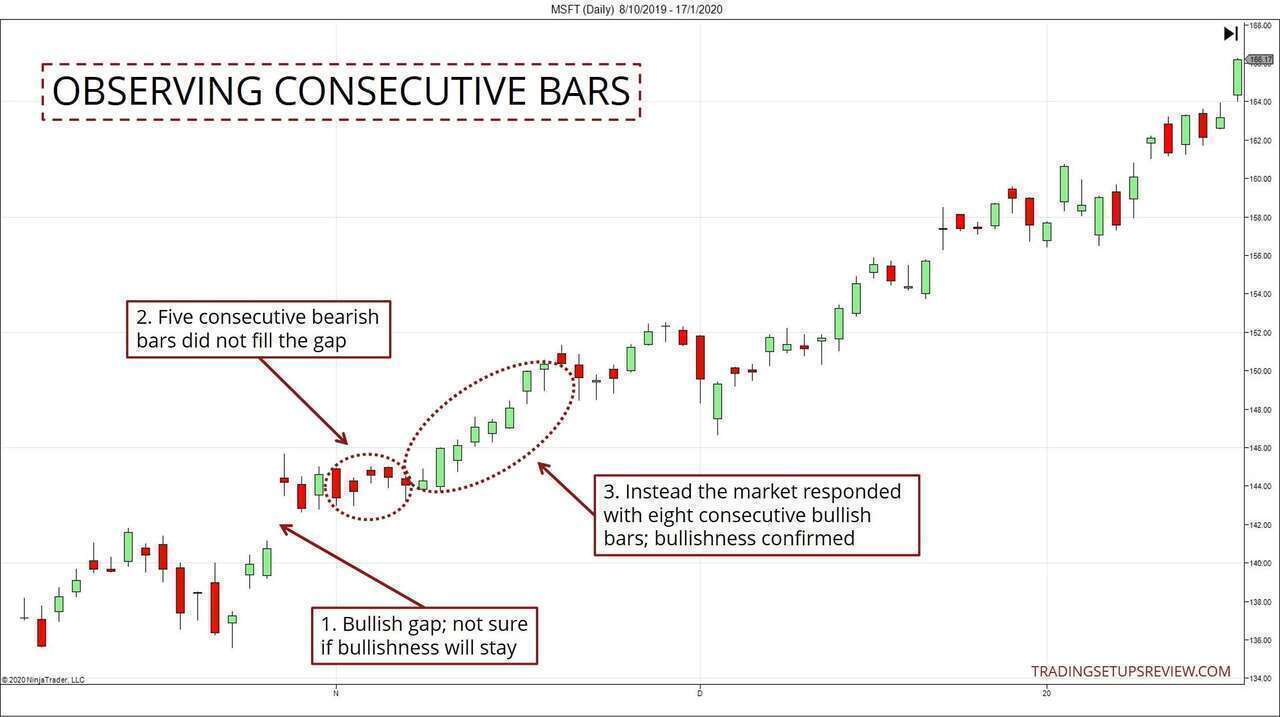
- After this bullish gap, we were not sure if the market would continue rising.
- These five consecutive bearish bars did not fill the gap.
- Instead, the market responded with a long bullish streak. This formation confirmed the bullish trend.
In many cases, consecutive price bars help you to identify sustained price thrusts. It grounds you in what the market is doing right now. But it does not mean that you must trade in the direction of these price thrusts.
For instance, this pullback strategy takes advantage of consecutive price bars that run counter to the prevailing trend.
Question #4: What is the degree of overlap with the previous bar?
The degree of overlap with the previous bar tells you the current market phase and the power of the price bar.
If the bar you are looking at overlaps entirely with the previous bar, the market is likely meandering. This is especially true with inside bars.
If you find minimal overlap between a price bar and the preceding one, it implies urgency.
The chart below points out both extremes.
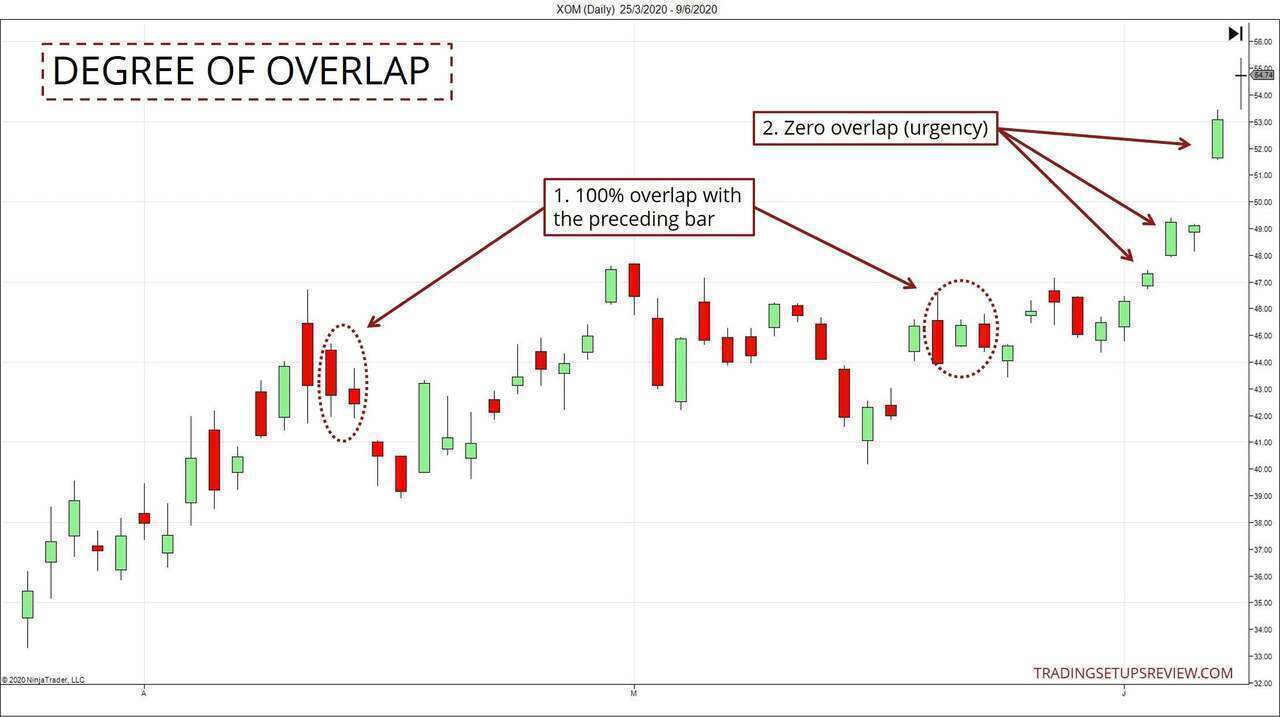
- 100% overlap bars are a clear sign of congestion.
- Zero overlap bars show urgency but are generally unsustainable.
Question #5: How did the market respond to an opening gap (if any)?
Gaps are extraordinary formations as they are vacuums where price did not trade at. For this reason, they are worthy of greater attention. While gaps are unusual on intraday charts, they are critical to analyzing daily bar (candlestick) charts.
Specifically, look bars with a bullish opening gap but bearish close. Or bars with a bearish opening gap and a bullish close. In these cases, the opening gap sets expectations which were not fulfilled.
Look at the example below.
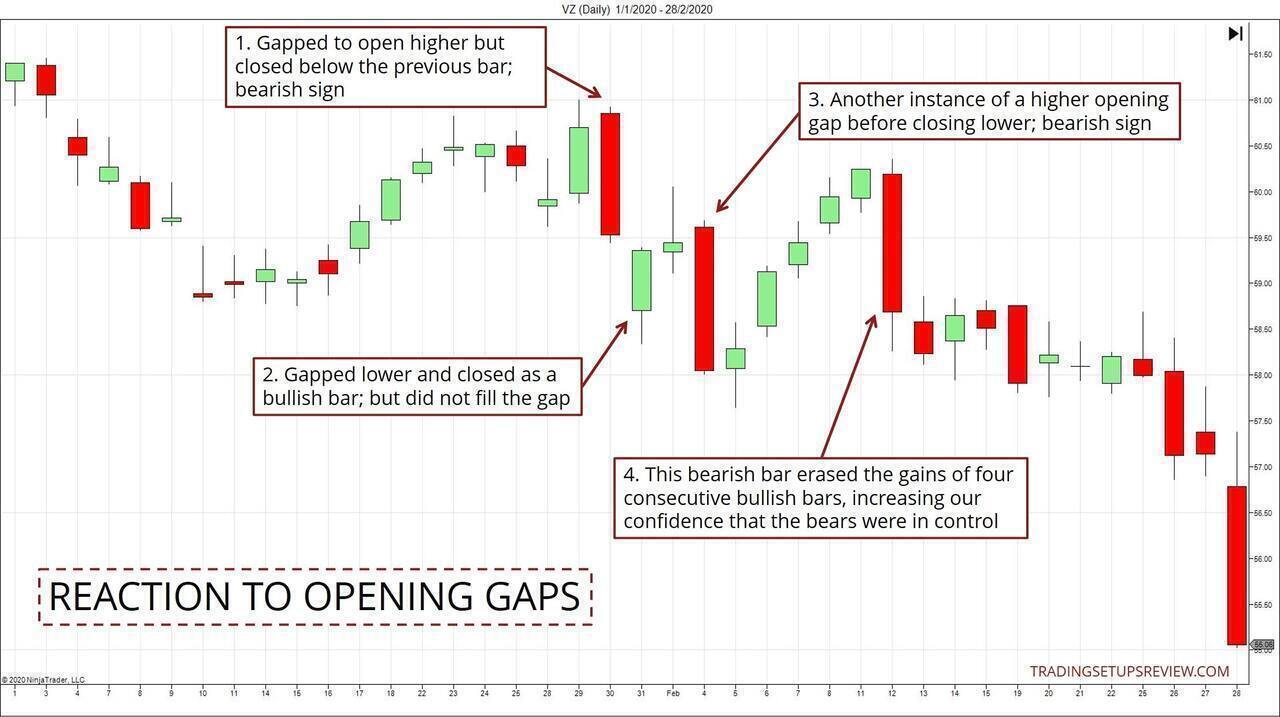
- This bar enjoyed a bullish opening gap. However, it ended up closing below the previous bar.
- This bar opened lower and closed higher, but it did not fill the gap. Hence, although it sent a bullish signal, it was not as strong as its bearish counterpart.
- Another formation like the one in Point #1 - bearishness.
- This bar erased the gains of four consecutive bullish bars, increasing our confidence level in the bearish sentiments.
Learn more about price gaps:
Question #6: How did the bar respond to a test of support/resistance?
From this question onwards, we’ll include more context to improve our price action bar analysis.
We will not discuss how to identify support/resistance here. You can refer to these articles to the standard methods for determining support and resistance.
The key idea is simple. Pay more attention to bars that test any support/resistance. You may find that the bar has difficulty breaking through the level. Or you may find that the bar completely ignores the level.
In either case, they help you to formulate a trading approach.
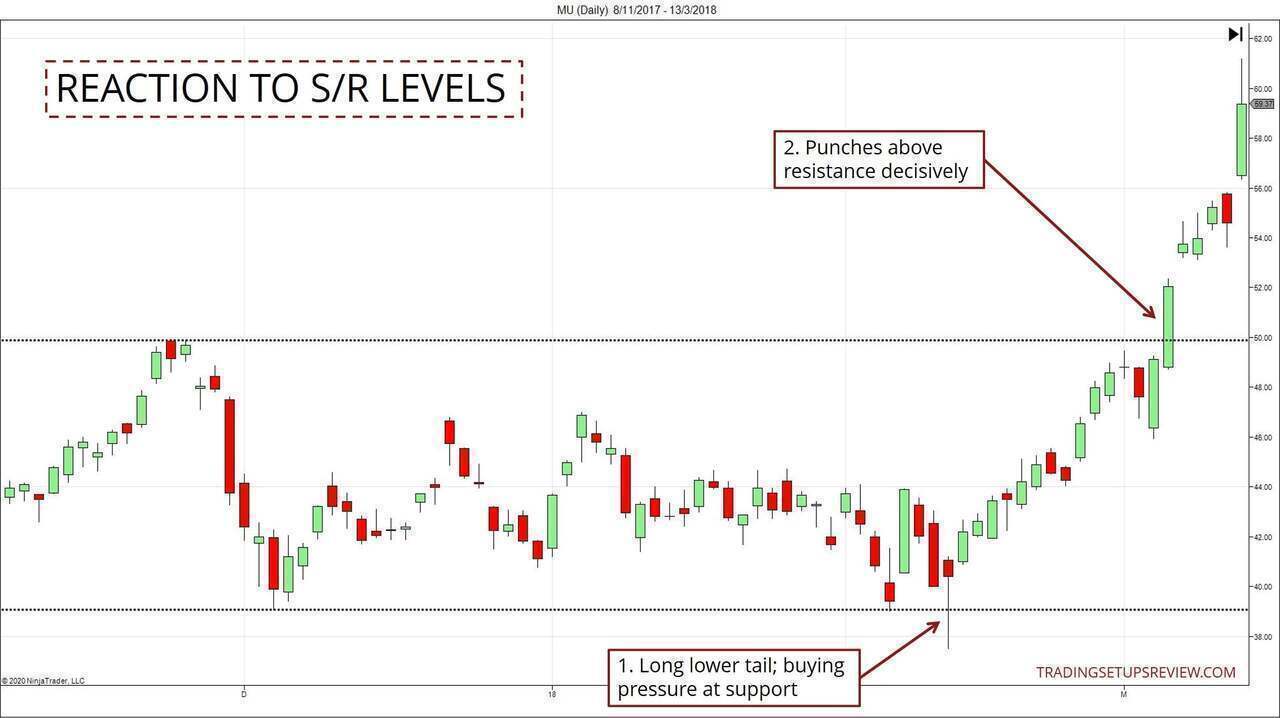
- This test of the support level resulted in a bullish Pin Bar. (As mentioned, a long lower tail implies bullish pressure.)
- On the other hand, the market completely ignored the resistance level and punched above it decisively.
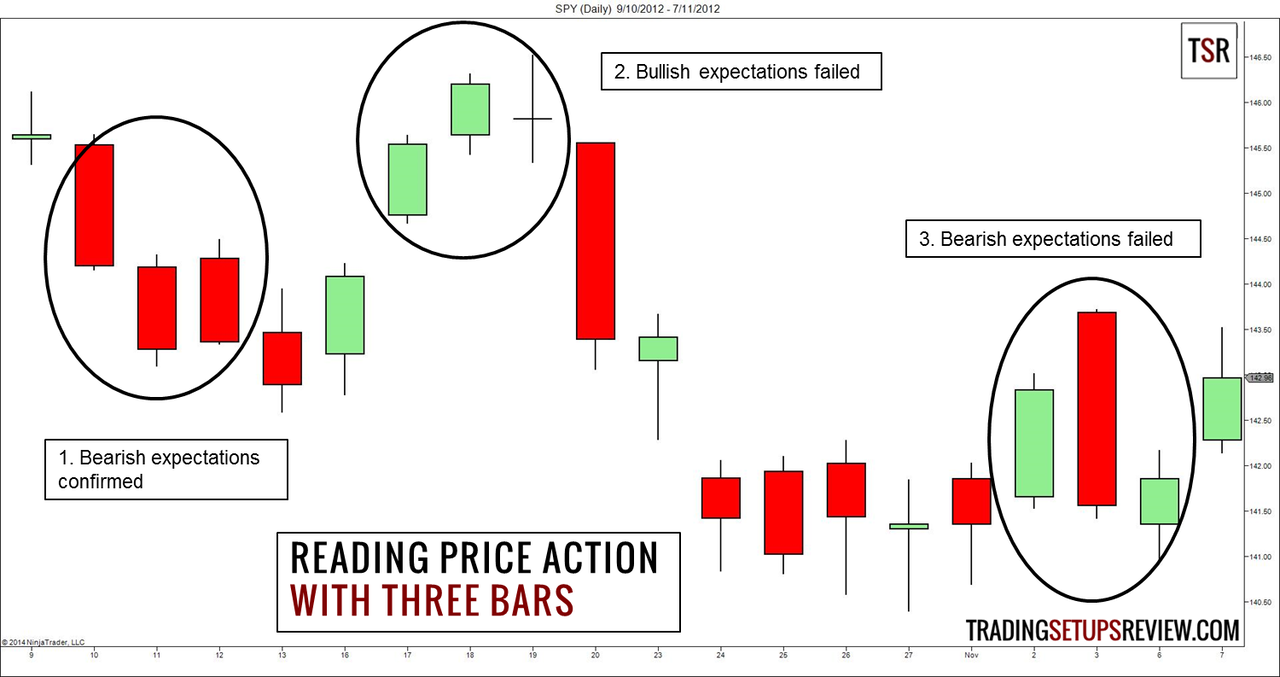
Question #7: What do the last three bars tell you?
Analyzing three bars as a group offers a lot more analytical value. Hence, it’s common to find many price action patterns made up of three bars. (E.g., Evening Star, Three-Bar Inside Bar)
- The first bar sets the context.
- The second bar sets the expectations.
- The third bar tells us if the expectations are met.
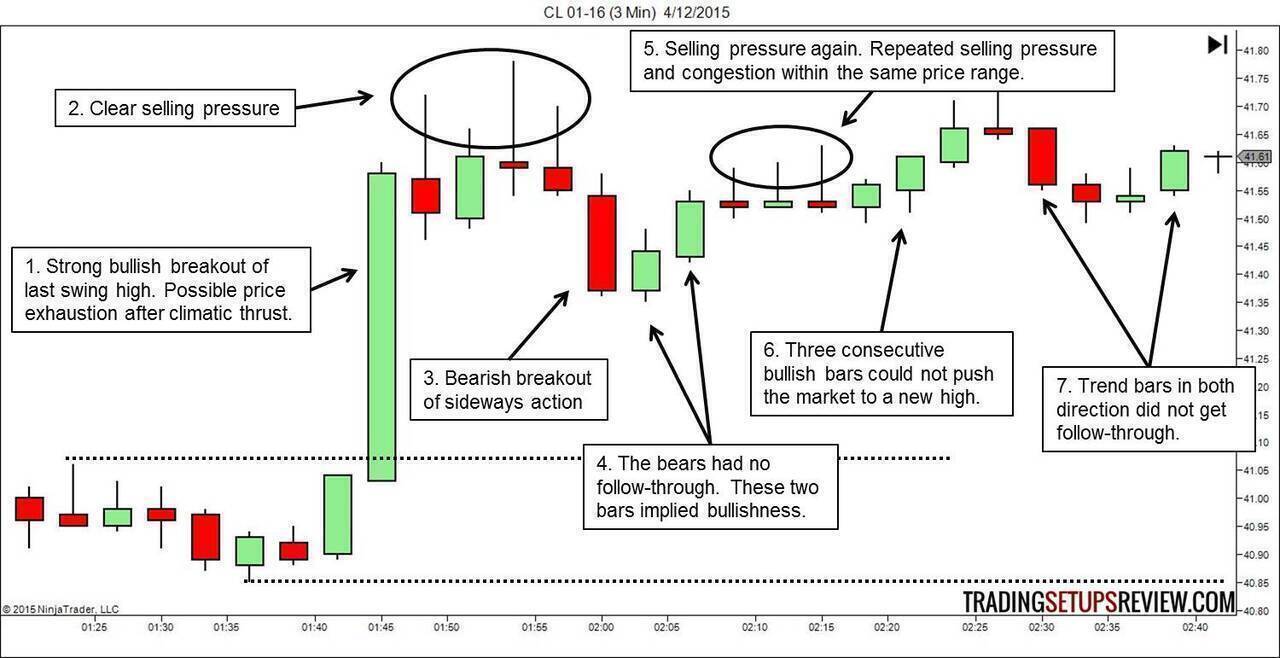
The chart below comes from the beginner’s guide to reading price action, which culminates in analyzing three candlesticks. Refer to it for a detailed explanation of the chart.
Question #8: What do the last twenty bars tell you?
Twenty is not a magic number. The point here is to introduce you to the idea of slowly stretching out your analysis and including more context.
Essentially, answer the earlier questions for a broader set of candlesticks.
For more examples, you can refer to this bar-by-bar analysis guide.
Bottom-up vs. Top-down Analysis
When you’re learning to understand price action, you need to go bottom-up. It’s hard to understand support and resistance when you don’t even know how to read a candlestick. That is why our questions build from bottom-up.
But when you’re trading price action, going top-down is more efficient and effective. A top-down approach means marking out support and resistance first. Then, with the market structure in mind, zoom into the lower-level details.
The top-down approach helps significantly in focusing your attention when trading. For instance, knowing where the support and resistance zones are will help you decide when to focus on bar-by-bar analysis.
Conclusion
Once you get enough practice reading and understanding price action, your perspective will change. You will find that you’re no longer searching for rigid price patterns. Instead, you will see yourself forming market expectations and (re)evaluating them constantly.
In-depth proficiency in price action analysis is only one part of the trading puzzle.
To translate your analysis to concrete setups worth your capital, you need to consider your studies within the context of risk and trade management. These include how to size your position, exactly how you will enter the market, and your exit plan.
Finally, you need to conclude with an expectancy assessment to see if the trade is worth taking.